
Direct Answer (TL;DR)
Modern residential solar panels lose roughly 1.0 to 2.0 percent of their rated power in Year 1, followed by a steady annual decline of 0.35 to 0.50 percent per year. Newer N-type TOPCon and heterojunction modules degrade slower than older P-type PERC panels, carrying 30-year warranties that guarantee at least 87.4 percent of day-one output.
For a typical 800 W balcony solar system, annual degradation amounts to less than 4 W of lost peak capacity per year. Over a standard five-year payback period, total degradation remains under 3 percent. Long-term production decline has virtually zero effect on balcony solar financial returns.
Every prospective solar buyer eventually asks the same practical question: how quickly will my solar panels lose power over time?
All photovoltaic hardware experiences gradual performance decline from outdoor weather, ultraviolet radiation, and thermal cycling. But online forums often exaggerate this loss, leading consumers to worry their balcony system will become useless within a decade.
The physics and real-world testing tell a different story.
Field studies, including historical desert testing where 30-year Arco Solar modules retained 53 percent power, confirm crystalline silicon panels last decades.
This guide explains the two stages of solar panel degradation, compares modern cell chemistries, walks through the exact math for an 800 W balcony array, and shows why degradation will not spoil your solar payback.
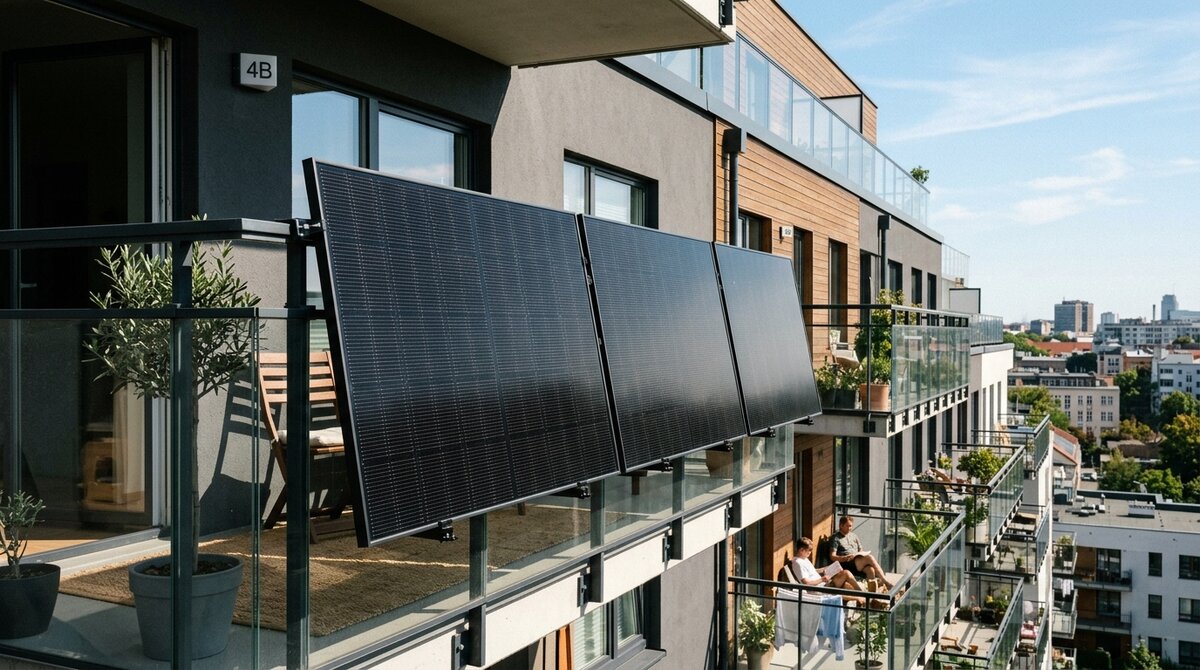 Modern balcony solar array with high-efficiency all-black monocrystalline modules.
Modern N-type TOPCon panels limit annual degradation to under 0.4 percent per year.
Photo: BalconySolar.org.
Modern balcony solar array with high-efficiency all-black monocrystalline modules.
Modern N-type TOPCon panels limit annual degradation to under 0.4 percent per year.
Photo: BalconySolar.org.
1. The two distinct stages of solar degradation
Solar panel degradation does not follow a single linear slope from day one. Instead, it occurs in two distinct phases:
100% Nameplate Output
 |
 |--[Phase 1: Initial Drop (LID / LeTID)] -> 1.0% to 2.0% in Year 1
 |
 \--[Phase 2: Long-Term Linear Aging]     -> 0.35% to 0.50% per year (Years 2 to 30)
Phase 1: Infant drop (LID and LeTID in Year 1)
When brand-new silicon solar panels first absorb outdoor sunlight, power output drops by 1.0 to 2.0 percent within days or weeks.
This initial loss stems from two well-documented physical mechanisms:
- Light-Induced Degradation (LID)Light-Induced Degradation (LID)A photochemical phenomenon occurring within the first few hours of light exposure where trace oxygen impurities bond with boron dopants in P-type silicon, trapping photo-generated electrons.: Traditional P-type silicon wafers are doped with boron. Sunlight triggers boron and oxygen impurities to form defect complexes that trap electrical charges before they reach cell contacts.
- LeTIDLeTIDLight and elevated Temperature-Induced Degradation, a slower defect formation mechanism occurring when cells operate above 50 °C under bright sunlight. (Light and elevated Temperature-Induced Degradation): A secondary defect mechanism that manifests in high operating temperatures above 50 °C (122 °F).
Once these initial chemical bonds stabilize, the infant drop ceases. Manufacturers account for LID in their first-year warranty specifications.
Phase 2: Long-term linear aging (Years 2 to 30)
After Year 1, panels settle into a predictable linear degradation rate of 0.35 to 0.50 percent per year under NREL degradation benchmarks.
This gradual decline results from environmental wear:
- Encapsulant browning and transmission loss: Solar glass stays clear, but polymer encapsulants slowly yellow over decades, reducing light reaching the cells.
- Thermal expansion and micro-cracking: Daily heating and cooling cycles stress cell ribbons, slowly increasing internal series resistance.
- Anti-reflective coating wear: Wind-blown dust and rain gradually erode nanoscale anti-reflective coatings on the front glass surface.
2. Cell technologies: TOPCon vs. PERC vs. HJT
How fast your panels degrade depends directly on the underlying cell architecture. The solar industry has transitioned through three major cell generations:
P-type Mono PERC (Previous standard)
Passivated Emitter and Rear Cell (PERC) technology dominated manufacturing between 2017 and 2023. PERC uses boron-doped P-type silicon wafers.
- Year 1 drop: Roughly 1.5 to 2.0 percent from boron-oxygen LID.
- Annual degradation: Roughly 0.50 to 0.55 percent per year.
- 25-year guaranteed output: Typically 80.0 to 84.8 percent of initial nameplate.
N-type TOPCon (Current industry leader)
TOPConTOPCon (Tunnel Oxide Passivated Contact)An advanced N-type silicon cell architecture using an ultra-thin silicon oxide tunnel layer that dramatically cuts surface recombination losses and resists degradation. (Tunnel Oxide Passivated Contact) has become the dominant technology for modern balcony solar panels.
TOPCon uses phosphorus-doped N-type silicon wafers. Because N-type wafers contain zero boron, boron-oxygen LID is completely eliminated.
- Year 1 drop: Capped at 1.0 percent or less.
- Annual degradation: 0.40 percent per year.
- 30-year guaranteed output: Typically 87.4 percent of initial nameplate.
Heterojunction (HJT, Premium tier)
Heterojunction technology layers thin amorphous silicon films onto crystalline N-type wafers.
- Year 1 drop: Approximately 1.0 percent.
- Annual degradation: 0.25 to 0.35 percent per year under NREL testing standards.
- 30-year guaranteed output: Up to 88.0 to 90.0 percent.
+----------------------+--------------------+--------------------+--------------------+
| Metric               | P-Type Mono PERC   | N-Type TOPCon      | N-Type HJT         |
+----------------------+--------------------+--------------------+--------------------+
| Year 1 Degradation   | 1.5% - 2.0%        | <= 1.0%            | <= 1.0%            |
| Annual Rate (Y2-30)  | 0.50% - 0.55%/yr   | 0.40%/yr           | 0.25% - 0.35%/yr   |
| 25-Year Retained     | 84.8%              | 89.4%              | 91.5%              |
| 30-Year Retained     | (Not warranted)    | 87.4%              | 88.0% - 90.0%      |
| LID Vulnerability    | Moderate (Boron)   | Zero (Phosphorus)  | Zero (Phosphorus)  |
+----------------------+--------------------+--------------------+--------------------+
3. The 800 W balcony solar reality check: The numbers
What does a 0.40 percent annual degradation rate mean in actual daily electricity production on a balcony?
Consider a standard balcony kit pairing two 400 W N-type TOPCon panels (800 W total nameplate) with an 800 W microinverter in a sunny US location producing 900 kWh in Year 1.
Year 1:   800 W peak  |  900 kWh generation  |  $180.00 bill offset
Year 5:   777 W peak  |  874 kWh generation  |  $174.80 bill offset  (Loss: $5.20/yr)
Year 10:  761 W peak  |  856 kWh generation  |  $171.20 bill offset  (Loss: $8.80/yr)
Year 20:  729 W peak  |  820 kWh generation  |  $164.00 bill offset  (Loss: $16.00/yr)
Year 30:  699 W peak  |  787 kWh generation  |  $157.40 bill offset  (Loss: $22.60/yr)
*(Calculated at a flat baseline electricity tariff of $0.20 per kWh)*
Notice the key takeaways from the production math:
- The 5-year payback window: In the first five years, when your kit pays for itself, cumulative degradation reduces your generation by less than 3 percent. The total financial loss across that entire period is roughly 15 dollars.
- At Year 10: Your panels still produce 95 percent of their original capacity.
- At Year 30: The panels continue producing 700 W of peak power, displacing nearly 800 kWh of grid electricity annually.
For personalized generation projections based on your state solar irradiance and utility rates, use our Household Sizing Simulator. To visualize 40-year trajectories across cell architectures or model hot-climate thermal derating, use our interactive Solar & Battery Degradation Trajectory Plotter.
4. Why balcony panels suffer less voltage degradation
Large commercial solar farms experience an additional failure mechanism called PIDPotential-Induced Degradation (PID)A performance drop caused by stray electrical leakage currents between semiconductor cells and the grounded metal frame under high string voltages. (Potential-Induced Degradation).
In rooftop and utility installations, dozens of panels connect in series, creating system voltages between 600 V and 1500 V DC. This high electrical potential drives stray sodium ions from the front glass into the silicon cell junction, causing severe power losses of up to 30 percent.
Balcony solar arrays operate differently:
- Each solar panel connects directly to its own independent MPPTMPPT (Maximum Power Point Tracker)An electronic circuit in the microinverter that continuously optimizes DC voltage and current to extract maximum power from each panel. input on a microinverter.
- Operating voltage per panel sits safely between 30 V and 45 V DC.
- With operating voltages under 50 V DC, PID is virtually non-existent in balcony solar systems.
Vertical or tilted mounting on open balcony railings provides natural rear ventilation. Cooler operating temperatures suppress thermal degradation compared to roof-mounted panels baking flush against hot shingles.
To compensate for seasonal low-light conditions and minor annual degradation, many owners pair 1000 W of panels with an 800 W microinverter. Review our balcony solar overpanelling guide to understand the benefits of array sizing.
5. Panels vs. microinverters: The true weak link
When budgeting for a balcony solar kit, understand which component requires maintenance.
Solar panels contain no moving parts and suffer zero mechanical wear. They will reliably generate electricity for 30 years or more.
The microinverter is different:
- Component stress: Microinverters house high-frequency switching transistors, power transformers, and electrolytic smoothing capacitors.
- Operating environment: Mounted outdoors beneath panels, inverters cycle from ambient freezing winter temperatures to 65 °C internal temperatures during peak summer afternoon operation.
- Expected lifespan: Quality microinverters carry 10-year to 12-year manufacturer warranties, with an expected operating lifespan of 12 to 15 years.
Plan to replace your microinverter once during the 30-year lifetime of your solar panels. Factoring a 200-dollar microinverter replacement into Year 12 still leaves balcony solar with excellent lifetime ROI.
6. What about battery storage degradation?
If you add battery storage to your balcony solar array, battery degradation requires far closer attention than panel degradation.
While modern solar panels degrade at 0.4 percent per year, lithium batteries degrade through active cycling and calendar aging, losing 15 to 20 percent of their capacity over 3,000 cycles (roughly 8 to 10 years).
Outdoor batteries also face freezing winter temperatures and scorching summer heat that can permanently damage cell chemistry if unmanaged.
To compare how different battery types hold up on an outdoor balcony, read our detailed engineering guide on balcony solar battery degradation: comparing LiFePO4, NMC, and Sodium-ion.
References and technical standards
- Jordan, D. C., & Kurtz, S. R. (2013). Photovoltaic Degradation Rates - An Analytical Review. Progress in Photovoltaics: Research and Applications, 21(1), 12-29 (NREL Report NREL/JA-5200-51664).
- International Electrotechnical Commission. IEC 61215-1:2021: Terrestrial photovoltaic (PV) modules - Design qualification and type approval.
- National Renewable Energy Laboratory. PVWatts Calculator Documentation and System Loss Assumptions. NREL (pvwatts.nrel.gov).
- Hafdaoui, H., et al. (2026). Testing and degradation assessment of mono-crystalline silicon PV modules after 30 years of operation in a desert climate. Next Energy, Elsevier (DOI: 10.1016/j.nxener.2026.101009).