
Direct Answer (TL;DR)
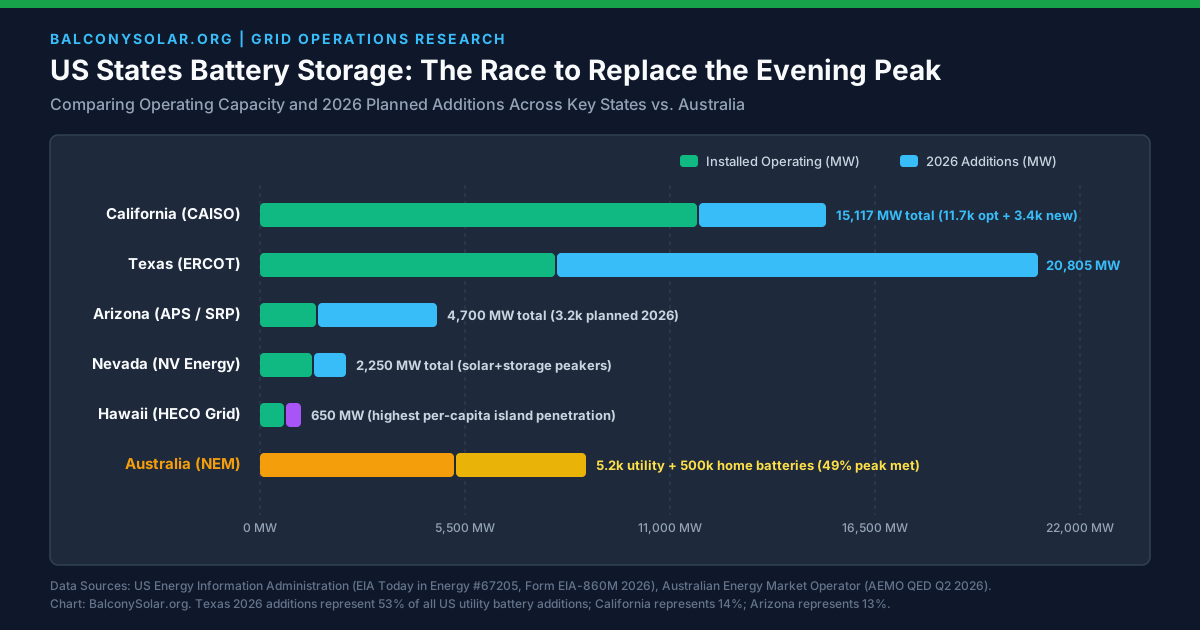
Three states account for roughly 80 percent of planned 2026 US utility battery additions per the EIA’s 2026 capacity additions preview. Texas leads with 12.9 GW (53 percent), followed by California with 3.4 GW (14 percent) and Arizona with 3.2 GW (13 percent). California leads total installed battery capacity at 11,717 MW, with evening battery discharge surpassing 12 GW during spring 2026 peaks. Hawaii leads in distributed storage penetration on island grids. For homeowners and renters, small-scale and balcony batteries provide a direct tool to soak midday solar generation and offset steep evening time-of-use rates without waiting for grid-scale procurement.
Australia recently ran the world’s largest real-time grid experiment. In August 2026, batteries met 49 percent of Australia’s dispatchable evening power demand between 5pm and 8pm. Over that same 12-month period, evening gas generation plummeted by 67 percent. As documented in our overview of Australia’s battery breakthrough, batteries proved they can displace gas peakers during the steepest demand ramps.
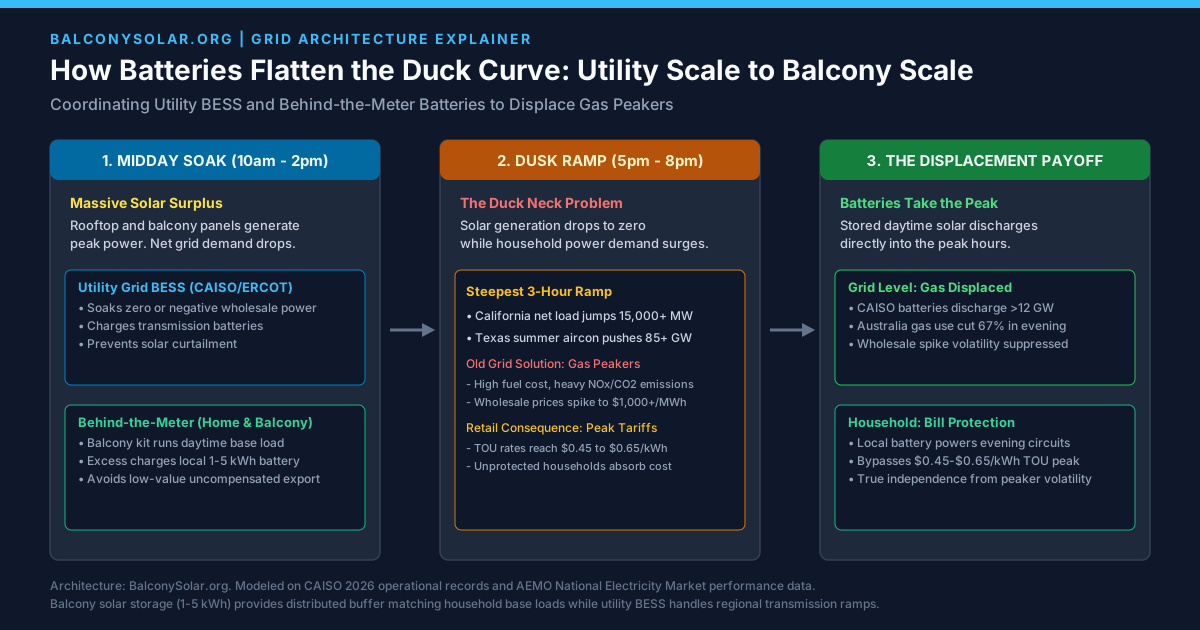
The United States is now experiencing the same economic and physical forces. The classic duck curveDuck CurveA graph of net electrical load over a day showing a steep midday belly caused by solar production followed by a sharp evening ramp when the sun sets.Explore the Duck Curve Interactive → floods grids with cheap solar at midday. It then creates a steep demand ramp as the sun sets and household activity surges.
This article reviews the official storage data from the US Energy Information Administration (EIA). We examine which US states are closest to replicating Australia’s evening battery lead. We also show how residential and balcony solar batteries fit into this broader grid transition.
1. The US Storage Concentration Story
The United States is not a single, unified electrical grid. Storage deployment is highly concentrated in states with high solar adoption, extreme seasonal temperatures, or competitive wholesale power markets.
According to the EIA’s 2026 capacity additions preview, developers expect to bring tens of gigawatts of new utility battery storage online. Three states account for approximately 80 percent of all new utility battery capacity planned for 2026:
- Texas: 12.9 GW (53 percent of planned national additions)
- California: 3.4 GW (14 percent of planned national additions)
- Arizona: 3.2 GW (13 percent of planned national additions)
Each of these leading states faces distinct regulatory frameworks and economic incentives. However, all three share the same underlying physics: abundant daytime solar electricity that must be shifted into the evening hours to avoid waste.
2. California: The Operational Pioneer
California remains the operational benchmark for grid-scale battery storage in North America.
According to EIA data and state trackers, California operates 11,717 MW of utility-scale battery capacity. This represents the largest operational fleet in the country. During the spring of 2024, batteries in the California ISO (CAISO) grid first surpassed natural gas generation during the evening peak. By March 29, 2026, CAISO recorded battery discharge exceeding 12 GW during the evening ramp.
California’s duck curve is the deepest in the nation. Midday net load frequently drops below zero, forcing curtailment of solar farms. As dusk arrives, net load ramps by more than 15,000 MW within three hours.
The Residential Shift: NEM 3.0 and Balcony Solar
California’s retail electricity rules have accelerated the transition to storage:
- Net Billing Tariff (NEM 3.0): Slashed daytime solar export credits by roughly 75 percent. This reform made solar-only rooftop arrays economically unattractive, pushing residential battery attachment rates above 60 percent on new installations.
- Balcony Solar Legislation: California recognized plug-in solar under statutory reforms including AB 205. The California Energy Commission (CEC) established guidelines for small systems up to 800 W. Read our guide to California balcony solar laws for local utility and safety requirements.
- Time-of-Use Spreads: Peak electricity rates between 4pm and 9pm reach $0.45 to $0.65 per kWh. Storing excess midday solar in a 1 to 5 kWh home battery yields immediate savings by avoiding expensive evening utility imports.
3. Texas: Rapid Scale in an Energy-Only Market
While California built its battery fleet over a decade of regulatory mandates, Texas is expanding storage through pure wholesale market arbitrage.
Texas currently operates 7,905 MW of utility battery storage. However, ERCOT leads the entire nation in forward development. The state accounts for 12.9 GW of battery capacity planned for 2026. This single-year expansion exceeds the entire existing California fleet.
The driver in Texas is peak demand volatility. During summer heat waves, air conditioning pushes ERCOT demand beyond 85 GW. In an energy-only market without capacity payments, wholesale electricity prices can spike to the $5,000 per MWh market cap within minutes. Batteries capture these massive price spreads by absorbing cheap midday solar or wind and discharging during afternoon scarcity events.
Texas Solar Rights and Tenant Realities
Texas provides statutory protections for solar property owners under Texas Property Code Section 202.010. Homeowners associations cannot outright ban solar equipment. However, plug-in solar kits face a fragmented utility landscape. Municipal utilities, rural cooperatives, and retail electric providers (REPs) in deregulated zones enforce separate interconnection policies. Review our Texas solar rules guide before connecting grid-tied equipment.
4. Arizona and Nevada: Desert Solar Meets Peaker Replacement
The desert southwest possesses the highest solar irradiance in North America. Both Arizona and Nevada are actively replacing planned gas peaker plants with large-scale battery systems.
Arizona: 3.2 GW in the 2026 Pipeline
Arizona represents 13 percent of all planned 2026 US battery additions. Regulated utilities like Arizona Public Service (APS) and Salt River Project (SRP) face severe summer evening peaks. Desert temperatures routinely remain above 100 degrees Fahrenheit well past 9pm, sustaining heavy air conditioning loads after solar output ceases.
APS and SRP have turned to 4-hour battery energy storage systems (BESS). These installations capture abundant desert sunshine and provide firm capacity through 10pm. In our Arizona solar regulations guide, we track local utility interconnection requirements for residential equipment.
Nevada: Mandated Solar-Plus-Storage
Nevada operates approximately 1,400 MW of utility storage, with another 850 MW under construction. Nevada’s Renewable Portfolio Standard and Integrated Resource Plans require utilities like NV Energy to pair large solar fields with storage.
Nevada protects homeowner solar rights under Nevada Revised Statutes Chapter 278. While utility-scale projects dominate headline capacity, residential storage is expanding rapidly under time-of-use tariffs.
5. Hawaii: The High-Penetration Island Laboratory
While continental grids rely on vast regional interconnections, Hawaii operates isolated island grids. Hawaii cannot import power from neighboring states when solar production drops.
As a result, Hawaii leads the nation in solar and storage penetration per customer:
- Rooftop Saturation: Over 30 percent of single-family homes in Oahu have rooftop solar.
- Grid Stability Programs: Hawaiian Electric (HECO) established the Battery Bonus program. This initiative pays upfront cash incentives and monthly bill credits to customers who add home batteries and commit to discharging power during the 6pm to 8pm peak.
- Peaker Retirement: The AES coal plant closure in Oahu was replaced by a combination of utility-scale storage (Kapolei Energy Storage facility) and distributed residential batteries.
Hawaii offers a preview of what mainland grids will face as solar penetration increases. When rooftop solar saturates local circuits, batteries transform from an optional accessory into an essential grid balancing tool.
6. How Home and Balcony Batteries Complete the System
Utility-scale mega-batteries solve transmission-level challenges. However, they do not eliminate retail transmission fees, distribution charges, or high evening time-of-use rates on customer bills.
This is where behind-the-meter residential and balcony batteries operate:
- Self-Consumption Optimization: An 800 W balcony solar setup produces between 2.5 and 4.0 kWh on a sunny day. In states with low solar export compensation, feeding excess power to the grid earns minimal credit. Storing that power in a compact 1 to 2 kWh battery preserves its full retail value.
- Bypassing Peak Rates: Discharging a small home battery between 5pm and 9pm powers household base loads. Running your refrigerator, home office, lighting, and entertainment from stored solar offsets power priced at peak time-of-use rates.
- No Extensive Construction: Unlike whole-home 13 kWh battery installations that cost upwards of $10,000, portable and modular balcony batteries connect directly to existing circuits without structural alterations.
To calculate how much energy your household can store and offset, explore our balcony solar sizing and payback calculator and read our guide to powering household circuits with batteries overnight.
7. State-by-State Comparison Matrix
The table below contrasts battery storage capacity, market structures, and regulatory frameworks across key states compared against the Australian benchmark:
| Jurisdiction | Operating Storage (MW) | 2026 Pipeline (MW) | Grid Market | Peak Ramp Driver | Balcony Solar Status |
|---|---|---|---|---|---|
| California | 11,717 MW | 3,400 MW | CAISO (Independent) | Deepest solar duck curve; sunset cooling ramp | Favorable (AB 205 / CEC rules) |
| Texas | 7,905 MW | 12,900 MW | ERCOT (Energy-Only) | Summer afternoon heat dome; 85+ GW peak | Statutory property protection; utility specific |
| Arizona | ~1,500 MW | 3,200 MW | Regulated (APS / SRP) | Late-evening desert air conditioning | Standard interconnection rules |
| Nevada | ~1,400 MW | ~850 MW | Regulated (NV Energy) | Evening resort and cooling demand | Standard interconnection rules |
| Hawaii | ~400 MW utility | ~200 MW utility | Isolated Island Grids | Island isolation; high rooftop solar saturation | Utility battery bonus programs |
| Australia (NEM) | 5,200 MW utility | 8,200 MW utility | National Electricity Market | Saturated rooftop solar; winter heating and summer cooling | National standard (AS/NZS 4777); 500k home batteries |
8. Primary Sources and Data Integrity
All storage capacity figures, operational timelines, and market projections cited in this analysis derive from official public records:
- US Energy Information Administration (EIA): Form EIA-860 (Monthly Schedule of Electric Generator Inventory) and Today in Energy report #67205.
- California Independent System Operator (CAISO): Operational battery dispatch records and EIA analysis of deepening California duck curves.
- Electric Reliability Council of Texas (ERCOT): Resource adequacy and generator interconnection queue reports.
- Australian Energy Market Operator (AEMO): Quarterly Energy Dynamics report (Q2 2026) documenting national battery dispatch and gas displacement.
As Australia demonstrated, battery storage reshapes electricity markets faster than traditional planning cycles anticipate. Whether deployed in massive 300 MW utility installations or modular 800 W balcony systems, batteries are closing the gap on the evening peak.